Performance Marketing Services Pricing: What You Should Expect to Pay in 2025
Understanding Performance Marketing Services
Performance marketing services represent a data-driven approach to digital advertising where businesses pay based on specific, measurable actions rather than traditional impressions or time-based contracts. Unlike conventional marketing methods, performance marketing ensures every dollar spent contributes directly to achieving concrete business objectives.
The core principle behind performance marketing lies in its accountability and transparency. Businesses only pay when predetermined goals are met—whether that's generating leads, driving sales, increasing website traffic, or securing app downloads. This results-oriented approach has revolutionized how companies allocate their marketing budgets and measure success.

Table of Contents
1. Understanding Performance Marketing Services
- Data-driven approach where businesses pay for measurable actions like clicks, leads, or sales
- Core components include paid search, social media ads, affiliate marketing, and display advertising
- Performance marketing delivers 40% ROI improvements compared to traditional marketing approaches
2. Performance Marketing Pricing Models Explained
- Cost-Per-Action (CPA) model with lead generation ranging $15-$150 per lead
- Cost-Per-Click (CPC) averages $2.69 for Google Search and $0.63 for display ads
- Revenue share models typically take 10-30% of attributed revenue with performance bonuses
3. Average Costs for Performance Marketing Services
- Small businesses pay $1,000-$15,000 monthly for basic to premium packages
- Mid-market companies invest $5,000-$75,000 monthly for standard to enterprise packages
- Enterprise organizations budget $25,000-$500,000+ monthly for custom multi-channel campaigns
4. Factors That Impact Performance Marketing Pricing
- Market competition and industry dynamics can increase costs 2-5x in competitive sectors
- Campaign complexity including multi-channel scope and advanced targeting requirements
- Agency expertise, reputation, and specialized technology capabilities affect premium pricing
5. Industry-Specific Performance Marketing Costs
- Legal services face highest costs with $5-$25 CPC and $200-$2,000 cost per lead
- E-commerce enjoys lower costs with $0.75-$2.50 CPC and 8-20% cost per sale
- Healthcare requires $3-$8 CPC with 15-25% compliance overhead costs
6. How to Budget for Performance Marketing Services
- Revenue-based allocation of 5-15% total revenue with startups investing 15-25%
- Customer lifetime value calculations set maximum acquisition cost at 25-35% of CLV
- Testing budgets should allocate 15-25% for new channel and creative experiments
7. ROI Expectations and Performance Benchmarks
- Search engine marketing delivers 200-400% ROI with email marketing achieving 300-600%
- E-commerce targets 4:1 to 8:1 return on ad spend (ROAS) ratios
- Initial results appear within 30-60 days with full ROI realization in 6-12 months
8. Choosing the Right Performance Marketing Agency
- Industry expertise and specialization align with business needs and regulatory requirements
- Pricing transparency includes detailed service breakdowns and performance guarantee explanations
- Technology capabilities encompass analytics, automation, and integration with existing systems
9. Performance Marketing Cost Optimization Strategies
- Automated bidding and budget management reduce costs by 10-25% through real-time optimization
- Creative testing and audience segmentation decrease acquisition costs by 15-35%
- Cross-channel attribution and technology stack optimization improve efficiency by 20-40%
Bottom Line First
Performance marketing services in 2025 range from $1,000-$15,000 monthly for small businesses to $25,000-$500,000+ for enterprises, with businesses typically achieving 200-600% ROI within 6-12 months. The most cost-effective approach combines strategic budget allocation (5-15% of revenue), performance-based pricing models, and systematic optimization that can reduce costs by 20-40% while maintaining results.
Key Components of Performance Marketing Services
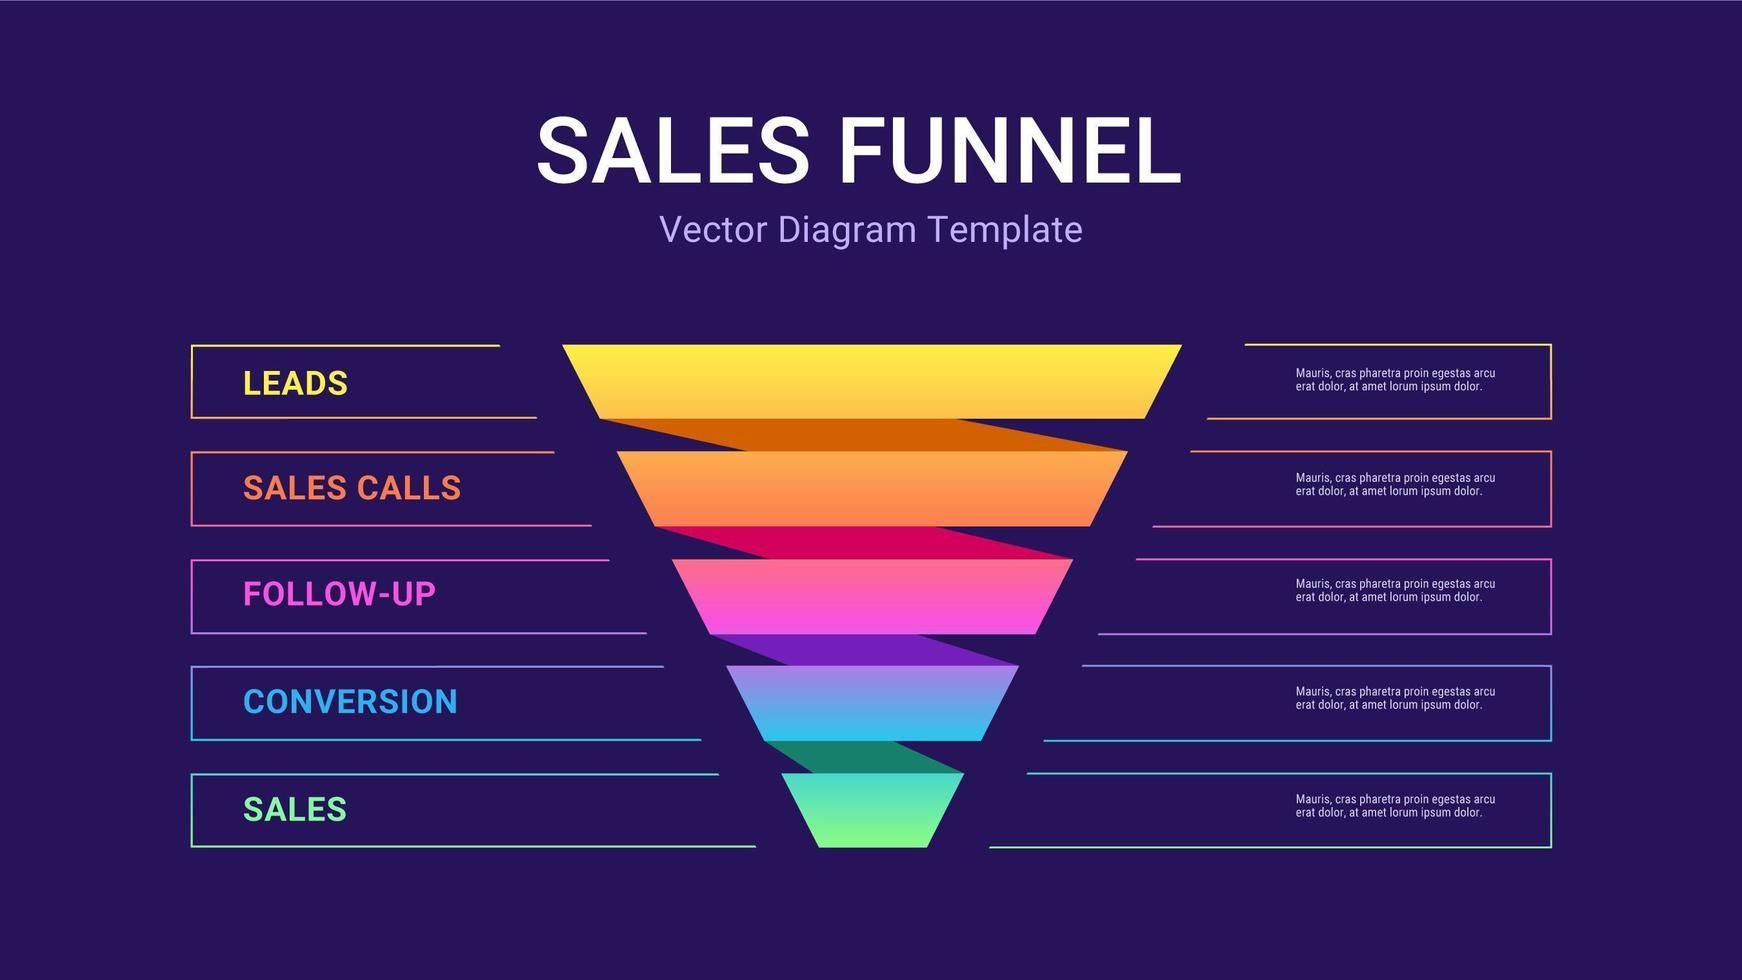
In the realm of digital growth, performance marketing services drive measurable results by focusing on specific actions. These services encompass a variety of strategies, each tailored to achieve distinct objectives and ultimately enhance your return on investment.
Key Components Include:
Paid Search Advertising (PPC)
- Google Ads
- Bing Ads
- Yahoo Ads
- other search engine platforms
Social Media Advertising (SEM)
- Meta Ads
- LinkedIn Ads
- TikTok Ads
- Snapchat Ads
- Pinterest Ads
- Reddit Ads
- X (Twitter) paid ads campaigns
Affiliate Marketing
Partnership-driven promotional activities with commission-based compensation
Display Advertising
- Banner ads
- Retargeting campaigns
- Programmatic advertising
Email Marketing
Performance-driven email campaigns with conversion tracking
Content Marketing
ROI-focused content creation and distribution strategies
The shift toward performance-based models reflects the growing demand for marketing accountability. According to recent industry data, businesses using performance marketing strategies see ROI improvements averaging 40% compared to traditional marketing approaches.
For companies consideringperformance marketing services, understanding the various pricing structures and cost expectations becomes crucial for making informed investment decisions.

Performance Marketing Pricing Models Explained
Understanding performance marketing pricing models is essential for businesses seeking to maximize their marketing investment. Each model offers distinct advantages and aligns differently with various business objectives and risk tolerances.
Cost-Per-Action (CPA) Model
The CPA model represents the purest form of performance marketing, where payment occurs only after a specific action is completed. These actions might include:
- Lead form submissions
- Product purchases
- App downloads
- Newsletter sign-ups
- Demo requests
Average CPA ranges in 2025:
- Lead generation: $15-$150 per lead
- E-commerce sales: 5-15% of order value
- App installs: $1-$10 per install
- B2B leads: $50-$500 per qualified lead
Cost-Per-Click (CPC) Model
Under the CPC model, businesses pay for each click their advertisements receive, regardless of subsequent user actions. This model provides more predictable costs while still maintaining performance accountability.
Average CPC benchmarks for 2025:
- Google Search Ads: $2.69 average
- Display Ads: $0.63 average
- Social Media Ads: $0.50-$3.00 range
- Industry-specific variations: Legal ($5-$10), Healthcare ($2-$5), E-commerce ($1-$3)
Revenue Share Model
Revenue share agreements align agency incentives directly with client success by taking a percentage of generated revenue. This model works particularly well for e-commerce businesses and companies with clear revenue attribution.
Typical revenue share percentages:
- 10-30% of attributed revenue
- Often combined with base retainer fees
- Performance bonuses for exceeding targets
Hybrid Pricing Models
Many agencies now offer hybrid approaches combining multiple pricing elements:
- Base retainer + performance bonuses
- Setup fees + ongoing CPA pricing
- Tiered pricing based on volume thresholds
These models provide stability for agencies while maintaining performance accountability for clients.

Average Costs for Performance Marketing Services
Performance marketing services cost varies significantly based on business size, industry, and campaign complexity. Current market data reveals the following pricing ranges for 2025:
Monthly Retainer Pricing
Small Businesses (Under $1M Revenue):
- Basic packages: $1,000-$3,000/month
- Standard packages: $3,000-$7,500/month
- Premium packages: $7,500-$15,000/month
Mid-Market Companies ($1M-$50M Revenue):
- Standard packages: $5,000-$15,000/month
- Advanced packages: $15,000-$35,000/month
- Enterprise packages: $35,000-$75,000/month
Enterprise Organizations ($50M+ Revenue):
- Custom packages: $25,000-$100,000+/month
- Multi-channel campaigns: $50,000-$250,000+/month
- Global campaigns: $100,000-$500,000+/month
Project-Based Pricing
- Campaign setup and optimization: $2,500-$15,000
- Landing page development: $1,500-$8,000
- Creative asset production: $1,000-$10,000
- Analytics implementation: $2,000-$12,000
Performance-Based Pricing Ranges
Lead Generation:
- B2C leads: $10-$100 per lead
- B2B qualified leads: $50-$500 per lead
- High-value service leads: $100-$1,000+ per lead
E-commerce Performance:
- Cost per sale: 8-25% of order value
- Return on ad spend (ROAS): 3:1 to 8:1 target range
- Customer acquisition cost: $25-$200+ depending on lifetime value
Industry-Specific Benchmarks
According to2025 digital marketing benchmark reports, industry variations significantly impact performance marketing services budget requirements:
High-Cost Industries:
- Legal services: 20-40% higher than average
- Healthcare: 15-30% premium
- Financial services: 25-50% above baseline
Moderate-Cost Industries:
- Technology/SaaS: Industry average
- Professional services: 10-20% above average
- Manufacturing: 5-15% below average
Lower-Cost Industries:
- E-commerce: 10-25% below average
- Local services: 15-30% below average
- Nonprofit: 20-40% below average

Factors That Impact Performance Marketing Pricing
Multiple variables influence performance marketing pricing, and understanding these factors helps businesses set realistic budget expectations and negotiate favorable terms with agencies.
Market Competition and Industry Dynamics
Highly competitive industries typically face elevated costs due to increased bidding competition and higher customer acquisition expenses. Industries like legal services, insurance, and financial products often see CPC rates 2-5 times higher than less competitive sectors.
Competition impact factors:
- Keyword competition levels
- Market saturation
- Seasonal demand fluctuations
- Regulatory restrictions
Campaign Complexity and Scope
More sophisticated campaigns requiring advanced targeting, multiple creative variants, and complex attribution models command higher pricing due to increased resource requirements.
Complexity indicators:
- Number of marketing channels
- Geographic targeting scope
- Audience segmentation requirements
- Creative production needs
- Technical integration complexity
Agency Expertise and Reputation
Established agencies with proven track records and specialized expertise typically charge premium rates reflecting their demonstrated value and reduced client risk.
Expertise factors affecting pricing:
- Industry specialization
- Certifications and partnerships
- Case study portfolio
- Team experience levels
- Technology and tool access
Client-Specific Requirements
Unique business needs, compliance requirements, and custom reporting demands can significantly impact pricing structures.
Common client-specific factors:
- Regulatory compliance needs
- Custom reporting requirements
- Integration with existing systems
- Brand guidelines adherence
- Approval process complexity
Technology and Platform Costs
The choice of advertising platforms, analytics tools, and optimization technologies directly affects overall campaign costs.
Technology cost considerations:
- Platform fees and minimums
- Premium tool subscriptions
- Custom development requirements
Third-party integration costs
Industry-Specific Performance Marketing Cost
Performance marketing services cost varies dramatically across industries due to factors like customer lifetime value, competition levels, and regulatory requirements. Understanding industry-specific benchmarks helps businesses set appropriate budget expectations.
Healthcare and Medical Services
Healthcare marketing faces unique challenges including HIPAA compliance, regulatory restrictions, and high-value customer relationships.
Typical healthcare performance marketing costs:
- Average CPC: $3-$8
- Cost per lead: $75-$400
- Monthly management: $5,000-$25,000
- Compliance overhead: 15-25% additional
Legal Services
Legal marketing represents one of the most competitive and expensive verticals due to high client lifetime values and intense competition.
Legal industry benchmarks:
- Average CPC: $5-$25
- Cost per lead: $200-$2,000
- Monthly management: $8,000-$40,000
- Personal injury leads: $1,000-$5,000 each
E-commerce and Retail
E-commerce performance marketing benefits from clear attribution and measurement, often resulting in more competitive pricing.
E-commerce performance marketing ranges:
- Average CPC: $0.75-$2.50
- Cost per sale: 8-20% of order value
- Monthly management: $3,000-$20,000
- ROAS targets: 4:1 to 8:1
B2B Technology and SaaS
Technology companies often require sophisticated lead nurturing and longer sales cycles, impacting pricing structures.
B2B tech performance marketing costs:
- Average CPC: $2-$6
- Cost per qualified lead: $100-$800
- Monthly management: $7,500-$35,000
- Customer acquisition cost: $200-$1,500
Real Estate
Real estate marketing combines local targeting with high-value transactions, creating unique pricing dynamics.
Real estate performance marketing ranges:
- Average CPC: $1.50-$4.00
- Cost per lead: $25-$150
- Monthly management: $2,500-$15,000
- Cost per qualified buyer: $500-$2,500
Financial Services
Financial services face regulatory constraints and high competition, resulting in elevated marketing costs.
Financial services benchmarks:
- Average CPC: $3-$10
- Cost per lead: $50-$300
- Monthly management: $6,000-$30,000
- Compliance requirements: 20-30% cost increase
Based on comprehensive benchmark data, these industry variations reflect market realities that directly impact performance marketing services budget planning.

How to Budget for Performance Marketing Services
Creating an effective performance marketing services budget requires strategic planning that balances ambitious growth goals with financial realism. Successful budgeting involves understanding your business metrics, market dynamics, and expected returns.
Revenue-Based Budget Allocation
Most businesses should allocate 5-15% of total revenue toward performance marketing, with variations based on growth stage and industry.
Revenue percentage guidelines:
- Startups (high growth): 15-25% of revenue
- Established companies: 5-12% of revenue
- Mature businesses: 3-8% of revenue
- E-commerce: 8-20% of revenue
Customer Lifetime Value (CLV) Calculations
Understanding your CLV enables more aggressive customer acquisition spending while maintaining profitability.
CLV-based budgeting formula:
- Maximum customer acquisition cost = CLV × 0.25-0.35
- Performance marketing budget = Monthly new customer targets × Target acquisition cost
- Safety margin: Add 20-30% buffer for optimization periods
Testing and Optimization Budgets
Allocate 15-25% of your performance marketing budget specifically for testing new channels, audiences, and creative approaches.
Testing budget allocation:
- New channel exploration: 40% of testing budget
- Creative and messaging tests: 35% of testing budget
- Audience and targeting experiments: 25% of testing budget
Seasonal and Market Adjustments
Build flexibility into your budget to capitalize on seasonal opportunities and market changes.
Seasonal considerations:
- Q4 holiday increases: 25-50% budget boost
- Industry-specific peak seasons
- Economic downturn adjustments: 10-20% reduction
- Market expansion opportunities: 20-40% increases
Performance Marketing Budget Framework
Phase 1: Foundation (Months 1-3)
- 60% budget allocation
- Focus on proven channels
- Conservative growth targets
- Heavy optimization emphasis
Phase 2: Scaling (Months 4-8)
- 80% budget allocation
- Channel expansion
- Accelerated growth targets
- Balanced optimization and scaling
Phase 3: Optimization (Months 9-12)
- 100% budget allocation
- Full channel portfolio
- Maximum efficiency focus
- Advanced attribution modeling
This systematic approach, combined with insights from Meta Marketing Agency's integrated marketing strategies, ensures budget allocation drives measurable business results.

ROI Expectations and Performance Benchmarks
Setting realistic ROI expectations is crucial for evaluating performance marketing services success and justifying continued investment. Industry benchmarks provide valuable reference points for measuring campaign effectiveness.
Industry ROI Benchmarks for 2025
According to comprehensive marketing benchmark reports, performance marketing ROI varies significantly across industries and channels.
Average ROI by Channel:
- Search engine marketing: 200-400% ROI
- Social media advertising: 150-300% ROI
- Display advertising: 100-200% ROI
- Email marketing: 300-600% ROI
- Affiliate marketing: 200-500% ROI
Industry-Specific ROI Expectations:
- E-commerce: 300-600% ROI
- B2B SaaS: 200-400% ROI
- Healthcare: 250-500% ROI
- Financial services: 150-350% ROI
- Professional services: 200-450% ROI
Performance Benchmarks by Campaign Objective
Lead Generation Campaigns:
- Cost per lead: Industry average ± 25%
- Lead-to-customer conversion: 5-15%
- Customer acquisition cost: <30% of CLV
- Campaign ROI: 200-400%
E-commerce Sales Campaigns:
- Return on ad spend (ROAS): 4:1 to 8:1
- Conversion rate: 2-5% (varies by industry)
- Average order value improvement: 10-25%
- Customer lifetime value increase: 15-30%
Brand Awareness Campaigns:
- Cost per thousand impressions (CPM): $1-$5
- Brand recall improvement: 15-30%
- Website traffic increase: 25-75%
- Engagement rate improvement: 20-50%
Timeline for Performance Marketing Results
Immediate Results (0-30 days):
- Initial traffic and impression data
- Baseline conversion metrics
- Platform learning completion
- Initial optimization insights
Short-term Performance (1-3 months):
- Meaningful conversion data
- Channel performance comparison
- Audience insight development
- Creative performance validation
Medium-term Optimization (3-6 months):
- Mature campaign optimization
- Cross-channel attribution insights
- Seasonal pattern identification
- Scaling decision points
Long-term Strategic Impact (6-12 months):
- Full ROI realization
- Brand equity development
- Market share improvements
- Customer lifetime value optimization
Setting Realistic Performance Expectations
First 90 Days:
- Focus on learning and optimization
- Expect 60-80% of mature performance
- Prioritize data collection over immediate ROI
- Invest in foundation building
Months 4-6:
- Achieve 80-95% of optimal performance
- Begin aggressive scaling discussions
- Implement advanced attribution models
- Expand successful channel strategies
Months 7-12:
- Reach full performance potential
- Explore new channel opportunities
- Implement sophisticated optimization
- Develop competitive advantages
These benchmarks, supported by data from leading performance marketing agencies, provide realistic frameworks for measuring success and making strategic decisions.

Choosing the Right Performance Marketing Agency
Selecting the right performance marketing agency significantly impacts both campaign success and overall costs. The decision requires careful evaluation of expertise, pricing structures, and cultural fit.
Agency Evaluation Criteria
Industry Expertise and Specialization
Look for agencies with demonstrated success in your specific industry or similar business models. Industry specialization often translates to faster results and more efficient spending.
Key evaluation factors:
- Relevant case studies and success stories
- Industry-specific certifications and partnerships
- Understanding of regulatory requirements
- Knowledge of industry-specific customer behaviors
Pricing Structure Transparency
The best agencies provide clear, detailed pricing information and explain how costs align with expected outcomes.
Pricing transparency indicators:
- Detailed service breakdowns
- Clear performance metrics and benchmarks
- Explanation of additional costs and fees
- Flexible pricing options based on business needs
Technology and Tool Capabilities
Modern performance marketing requires sophisticated technology stacks for optimization, attribution, and reporting.
Technology evaluation checklist:
- Analytics and attribution platforms
- Automation and optimization tools
- Creative production capabilities
- Reporting and dashboard functionality
- Integration with existing business systems
Red Flags to Avoid
Pricing Red Flags:
- Agencies requiring large upfront payments
- Vague or unclear pricing structures
- Reluctance to discuss performance guarantees
- Significantly below-market pricing without explanation
Service Red Flags:
- Promises of unrealistic results or timelines
- Lack of relevant case studies or references
- Poor communication during evaluation process
- Unwillingness to provide detailed strategy proposals
Agency Size Considerations
Large Agencies ($10M+ Revenue):
- Advantages: Resources, stability, established processes
- Disadvantages: Higher costs, potential for less attention
- Best for: Enterprise clients, complex multi-channel campaigns
Mid-Size Agencies ($1M-$10M Revenue):
- Advantages: Balance of resources and attention, competitive pricing
- Disadvantages: Potential resource constraints during busy periods
- Best for: Mid-market companies, growing businesses
Boutique Agencies (<$1M Revenue):
- Advantages: Personal attention, competitive rates, agility
- Disadvantages: Limited resources, potential capacity issues
- Best for: Small businesses, specialized needs, budget-conscious clients
Performance Marketing Agency Partnership Models
Retainer-Based Partnerships
Monthly fee structures provide predictable costs and dedicated resources.
Benefits:
- Consistent service delivery
- Predictable budgeting
- Long-term strategic planning
- Dedicated team assignment
Performance-Based Partnerships
Payment tied directly to results aligns agency and client incentives.
Benefits:
- Reduced risk for clients
- Strong performance motivation
- Scalable cost structure
- Shared success accountability
Hybrid Partnership Models
Combination approaches balance predictability with performance accountability.
Typical structures:
- Base retainer + performance bonuses
- Setup fee + ongoing CPA pricing
- Revenue share + minimum monthly fees
For businesses exploring Web3 and metaverse marketing opportunities, specialized agency expertise becomes even more critical given the emerging nature of these channels.

Performance Marketing Cost Optimization Strategies
Effective cost optimization in performance marketing requires systematic approaches that maintain or improve results while reducing expenses. Strategic optimization can typically reduce costs by 15-35% while maintaining campaign effectiveness.
Automated Bidding and Budget Management
Modern performance marketing platforms offer sophisticated automation tools that optimize spending in real-time based on performance data.
Automation strategies:
- Smart bidding algorithms for CPC optimization
- Automated budget allocation across campaigns
- Real-time performance monitoring and adjustments
- Predictive scaling based on historical data
Expected cost reductions:
- 10-25% improvement in cost efficiency
- 15-30% reduction in management overhead
- 20-40% faster optimization cycles
Creative Testing and Optimization
Systematic creative testing identifies high-performing assets while eliminating ineffective spending on poor-performing content.
Creative optimization framework:
- A/B testing for headlines, images, and calls-to-action
- Video vs. static creative performance analysis
- Audience-specific creative customization
- Seasonal and trending content incorporation
Performance improvements:
- 20-50% improvement in click-through rates
- 15-35% reduction in cost per conversion
- 25-60% increase in engagement rates
Audience Segmentation and Targeting Refinement
Advanced audience targeting reduces wasted spend by focusing resources on highest-converting segments.
Targeting optimization tactics:
- Lookalike audience development from best customers
- Negative audience exclusion for non-converters
- Geographic and demographic refinement
- Behavioral and interest-based segmentation
Cost optimization results:
- 25-45% reduction in irrelevant traffic
- 20-40% improvement in conversion rates
- 15-30% decrease in overall customer acquisition costs
Cross-Channel Attribution and Budget Allocation
Proper attribution modeling ensures budget allocation to highest-performing channels and touchpoints.
Attribution strategies:
- Multi-touch attribution modeling implementation
- Cross-device tracking and measurement
- Offline conversion integration
- Customer journey analysis and optimization
Performance Marketing Technology Stack Optimization
Consolidating and optimizing your technology stack can significantly reduce costs while improving efficiency.
Technology optimization approaches:
- Platform consolidation to reduce subscription costs
- Integration automation to reduce manual work
- Data pipeline optimization for faster insights
- Reporting automation to reduce analysis time
Technology cost savings:
- 20-40% reduction in platform and tool costs
- 30-50% decrease in manual optimization time
- 15-25% improvement in campaign response speed
Long-term Cost Efficiency Strategies
Customer Lifetime Value Optimization
Focus on acquiring customers with higher long-term value rather than just lowest acquisition cost.
Organic Asset Development
Build owned media assets that reduce dependence on paid channels over time.
Competitive Intelligence
Monitor competitor strategies to identify cost-effective opportunities and avoid bidding wars.
Seasonal Planning
Develop annual plans that anticipate cost fluctuations and optimize budget timing.
These optimization strategies, when implemented systematically, typically result in 20-40% improvement in overall performance marketing efficiency while maintaining or improving results quality.

Frequently Asked Questions
What is the average cost of performance marketing services in 2025?
Performance marketing services cost in 2025 ranges from $1,000-$15,000 monthly for small businesses, $5,000-$75,000 for mid-market companies, and $25,000-$500,000+ for enterprise organizations. Costs depend on business size, industry competition, campaign complexity, and chosen pricing model.
How do performance marketing pricing models work?
Performance marketing pricing typically follows these models:
- Cost-Per-Action (CPA): Pay only when specific actions occur (leads, sales, downloads)
- Cost-Per-Click (CPC): Pay for each ad click received
- Revenue Share: Pay a percentage of generated revenue
- Hybrid Models: Combination of retainer fees plus performance bonuses
Most agencies offer multiple pricing options to match client risk tolerance and budget preferences.
What factors most significantly impact performance marketing costs?
The primary factors affecting performance marketing services budget include:
- Industry competition levels (legal and healthcare cost 2-5x more than average)
- Campaign complexity and channel scope
- Target audience size and specificity
- Geographic targeting requirements
- Agency expertise and reputation
- Technology and platform requirements
- Compliance and regulatory needs
How long does it take to see ROI from performance marketing?
Typical ROI timelines for performance marketing services are:
- 0-30 days: Initial data collection and baseline establishment
- 1-3 months: Meaningful conversion data and optimization insights
- 3-6 months: Mature campaign performance and scaling decisions
- 6-12 months: Full ROI realization and strategic impact
E-commerce campaigns often show results faster (30-60 days) while B2B campaigns may require 3-6 months for full evaluation.
What's included in typical performance marketing service packages?
Standard performance marketing services typically include:
- Campaign strategy development and planning
- Platform setup and configuration
- Creative asset development and testing
- Ongoing optimization and management
- Performance tracking and reporting
- Landing page optimization
- Audience research and targeting
- A/B testing and experimentation
Premium packages may add advanced attribution modeling, custom integration development, and dedicated account management.
How do I determine the right performance marketing budget for my business?
Calculate your performance marketing services budget using this framework:
- Revenue-based: Allocate 5-15% of annual revenue (higher for growth-stage companies)
- CLV-based: Set customer acquisition cost at 25-35% of customer lifetime value
- Goal-based: Determine new customer targets and multiply by acceptable acquisition cost
- Competitive-based: Research industry benchmarks and competitive spending levels
Always include a 20-30% buffer for testing and optimization activities.
What ROI should I expect from performance marketing services?
Realistic performance marketing services ROI expectations by industry:
- E-commerce: 300-600% ROI (4:1 to 8:1 ROAS)
- B2B SaaS: 200-400% ROI
- Healthcare: 250-500% ROI
- Professional Services: 200-450% ROI
- Financial Services: 150-350% ROI
Results typically improve over time as campaigns optimize and audience insights develop.
How do I choose between different performance marketing agencies?
Evaluate potential agencies based on:
- Industry expertise: Relevant case studies and vertical knowledge
- Pricing transparency: Clear service breakdowns and cost explanations
- Technology capabilities: Advanced tools and integration options
- Communication quality: Responsiveness and strategic insight
- Performance guarantees: Realistic commitments and accountability measures
- Cultural fit: Alignment with business values and working styles
Request detailed proposals and speak with current clients before making decisions.
What are the hidden costs in performance marketing services?
Common additional costs in performance marketing pricing include:
- Platform fees and minimum spends (separate from agency fees)
- Creative production costs for assets and videos
- Landing page development and optimization
- Advanced analytics and attribution tools
- Compliance and legal review costs
- Additional testing and experimentation budgets
Always request comprehensive cost breakdowns including potential additional expenses.
How can I optimize performance marketing costs without sacrificing results?
Key cost optimization strategies:
- Automated bidding: Use platform AI for real-time optimization
- Creative testing: Systematically test and eliminate poor performers
- Audience refinement: Focus spend on highest-converting segments
- Attribution improvement: Allocate budget to highest-impact touchpoints
- Technology consolidation: Reduce redundant platform subscriptions
- Long-term planning: Develop annual strategies to anticipate cost fluctuations
These approaches typically reduce costs by 15-35% while maintaining or improving performance.
Key Takeaways
Pricing Structure & Investment
- Small business packages: $1,000-$15,000 monthly with basic to premium service levels
- Enterprise solutions: $25,000-$500,000+ monthly for complex multi-channel campaigns
- Revenue allocation guideline: 5-15% of total revenue (startups invest 15-25% for rapid growth)
Pricing Models & Cost Expectations
- CPA model ranges: $15-$150 per lead for lead generation, $50-$500 for B2B qualified leads
- CPC benchmarks: $2.69 average for Google Search, $0.63 for display, $0.50-$3.00 for social media
- Revenue share agreements: 10-30% of attributed revenue with performance bonus structures
Industry-Specific Variations
- High-cost sectors: Legal ($5-$25 CPC), Healthcare ($3-$8 CPC), Financial services (25-50% above baseline)
- Moderate-cost industries: Technology/SaaS at industry average, Professional services 10-20% above
- Lower-cost sectors: E-commerce (10-25% below average), Local services (15-30% below average)
ROI & Performance Benchmarks
- Channel-specific ROI: Search marketing (200-400%), Email marketing (300-600%), Social media (150-300%)
- Industry ROI expectations: E-commerce (300-600%), B2B SaaS (200-400%), Healthcare (250-500%)
- Timeline for results: Initial data (0-30 days), meaningful insights (1-3 months), full ROI (6-12 months)
Cost Optimization Strategies
- Automated bidding systems: 10-25% cost efficiency improvement through real-time optimization
- Creative testing programs: 20-50% improvement in click-through rates and 15-35% cost reduction
- Technology consolidation: 20-40% reduction in platform costs with 30-50% less manual work
Agency Selection Criteria
- Expertise evaluation: Industry specialization, relevant case studies, regulatory knowledge
- Pricing transparency: Detailed service breakdowns, clear performance metrics, flexible options
- Technology capabilities: Advanced attribution, automation tools, integration capabilities
Budget Planning Framework
- CLV-based budgeting: Maximum acquisition cost should be 25-35% of customer lifetime value
- Testing allocation: Reserve 15-25% of budget for new channel and creative experiments
- Seasonal adjustments: Plan 25-50% budget increases for Q4 holiday periods and peak seasons
Success in performance marketing requires viewing it as strategic investment rather than expense, with proper budget allocation, expert agency partnerships, and systematic optimization driving sustainable competitive advantages and measurable business growth.